A different perspective for Malawi's 'Water Crisis'
Hi and welcome back to my blog on Water and Sanitation in Africa. In this post, I have come across some interesting literature regarding water quality in Lilongwe, Malawi that challenged mainstream, oversimplified ideas.
The background:
As of this year, an estimated 1,170,000 people live in Lilongwe with a growth rate of 4.38%(World
Population Review)compared to a total 19,800,000 in Malawi (World
Population Review).
According to UNICEF, there is an inequality between urban and rural areas. Improved drinking water sources are said to be more common 'at 87%' in urban areas than rural '63%'. What does that even mean? 87% coverage? What does 87% coverage even look like? More people living in rural areas have to spend more time collecting water than those in urban areas.
More importantly, however, are the reasons proposed:
- Neglected/Old Water points
- Poor access to sanitation services
- Increased Droughts and Floods
- Poor hygienic practice (in the form of open defecation & not washing hands)
Why are you telling me this?
So you may be thinking this exact question right now. Here's why.
I found it very interesting because throughout my life, adverts and charities frame Africa as a whole as a country (that's right, not continent) that needs saving from western intervention. More importantly, that the problems are simple and so the solutions are simple like donating money for a well. Boakye-Ansah et al. (2016) however, have a different idea.
What did they do?
They carried out a study in Lilongwe, the capital of Malawi. The city is divided into 58 areas. Of these 58 areas, drinking water samples were collected from two low-income areas (56 and 7) and two higher-income areas (47 and 2) (see figure 1).
The Lilongwe Water Board (LWB) network supplies 78% of the city population. 37% through in-house connections and 41% through water Kiosks.
I had never come across the term water kiosk until this module so, if you're like me, here's an example:
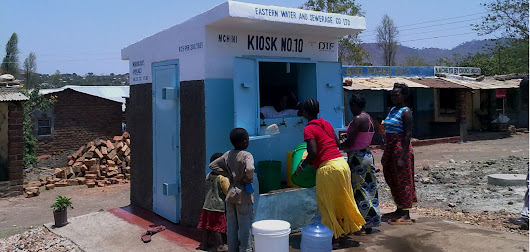
image of a water kiosk (source)

The samples were collected in sterile 300mL Pyrex bottles and stored in insulated cool boxes with ice packs to be transported to the laboratory where they were processed. They then performed some physicochemical and microbiological analyses.
What did they find?
- concentration of E.coli and total coliforms was low at outlet treatment works and reservoirs but increased as water flowed to the settlements.
- E.coli and coliform concentrations were higher at kiosks and in water stored at household level.
- In higher income areas: 57% of samples had coliforms, 3% E.coli in area 47 and 70% coliforms with 30% E.coli in area 2
- In lower income kiosk areas: 98% of samples had coliforms, 64% in area 56 and 74% coliforms, 47% in area 6
- In lower income household: 100% coliforms with 91% E.coli in area 56, 100% coliforms, 100% E.coli in area 2
What does that mean?
Firstly, this means that higher income areas still had contaminated, unsafe drinking water. However, there was a clear difference in water quality between the lower-income areas and higher-income areas.
In addition, if there was higher concentration of coliforms and E.coli at the settlements than at the water treatment works and reservoirs, this meant water was being contaminated as it was transported. This is thought to be because of the quality of pipes leading to particles in the water acting as a shield for microorganisms to avoid disinfection (Lynch
et al. 2014)
In fact, Boakye-Ansah et al.(2016) mention the higher income areas having longer, underground, better quality pipes whereas the low income areas have fewer pipes that are smaller in size and poorer in quality.
Wait! There's a little bit more!
So if this wasn't enough, when looking at the water network of the study area, Boakye-Ansah et al. (2016) illustrated that there was less water being supplied to the low income areas, which actually had larger populations (see figure 2).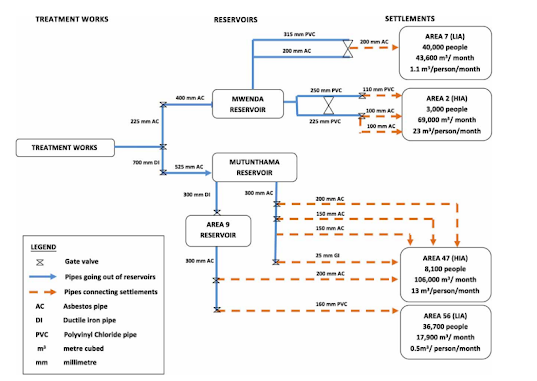
Fig. 2 : network of the study area (source)
The main ideas
The biggest takeaway from this literature was that there was a clear difference in the supply network to Higher income areas and low income areas. The inequality in water quality in Lilongwe between low income areas and higher income areas were mainly attributed to the "socio-political decisions concerning the design and management of the supply network by the competent actors and institutions."
This emphasized the idea that water issues are very complex and are not always as simple as charities advertising through the mainstream media suggest. I just think it's very important to see the more socio-political causes of water quality issues.
Thanks for tuning in again!


really enjoy your writing style!
ReplyDeleteYou stated that “the inequality in water quality in Lilongwe between low income areas and higher income areas were mainly attributed to socio-political decisions concerning design and management of supply network by actors and institutions". Is it possible that this challenge is not limited to Lilongwe but common across postcolonial African societies but also a problem of centralised water distribution. This is a nice review of water and sanitation challenges in Lilongwe, well presented and showing good engagement with literature.
ReplyDeleteMy question is to help thinking for future post.